GRC Software and Insolvency Training in One Powerful Suite
Stay compliant, resilient, and ahead of regulatory change with the Aryza Practice Suite. This integrated suite of software and training solutions helps financial services and insolvency professionals manage risk, maintain compliance, improve operational performance, and keep teams up to date with evolving requirements.
Whether you’re navigating complex GRC frameworks or preparing for insolvency and restructuring qualifications, the Aryza Practice Suite offers the tools, training, and technology you need to succeed.
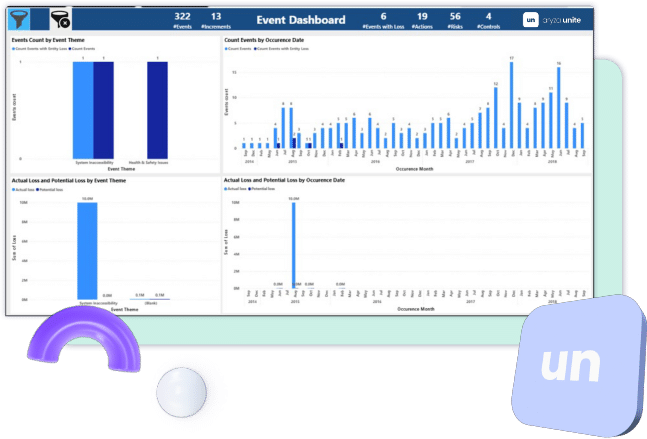
GRC, automated and connected
![]()
Aryza Unite unifies risk, compliance, and governance into one powerful platform – purpose-built for financial institutions. Modular, fast to implement, and trusted by leading firms.
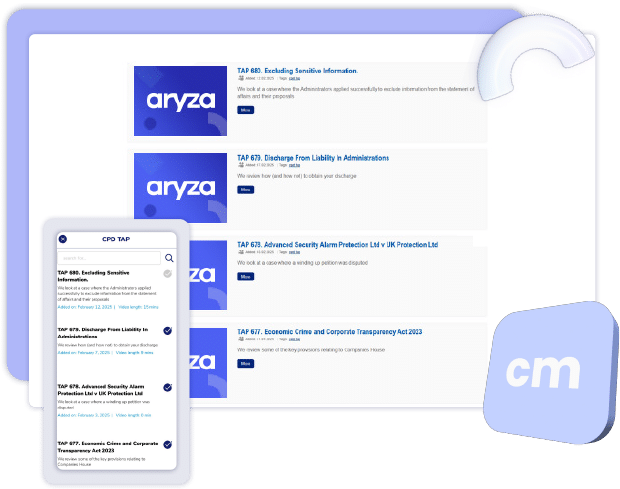
Insolvency Training
![]()
Whether you’re looking to enhance expertise, maintain compliance, or improve operational efficiency, Aryza Comply provides the knowledge and skills you need to succeed.
Latest GRC News


Contact us
"*" indicates required fields