Governance, Risk, Compliance and Training
Stay compliant, efficient, and ahead of industry changes with our comprehensive training and compliance solutions. Aryza Practice Suite is a range of tools that allows you to manage risks, navigate complex industry and government regulations, streamline operations for faster decision-making, and keep your team’s qualifications current.
Tools and training to stay ahead of the game
![]()
Whether you’re looking to enhance expertise, maintain compliance, or improve operational efficiency, Aryza Comply provides the knowledge and skills you need to succeed.
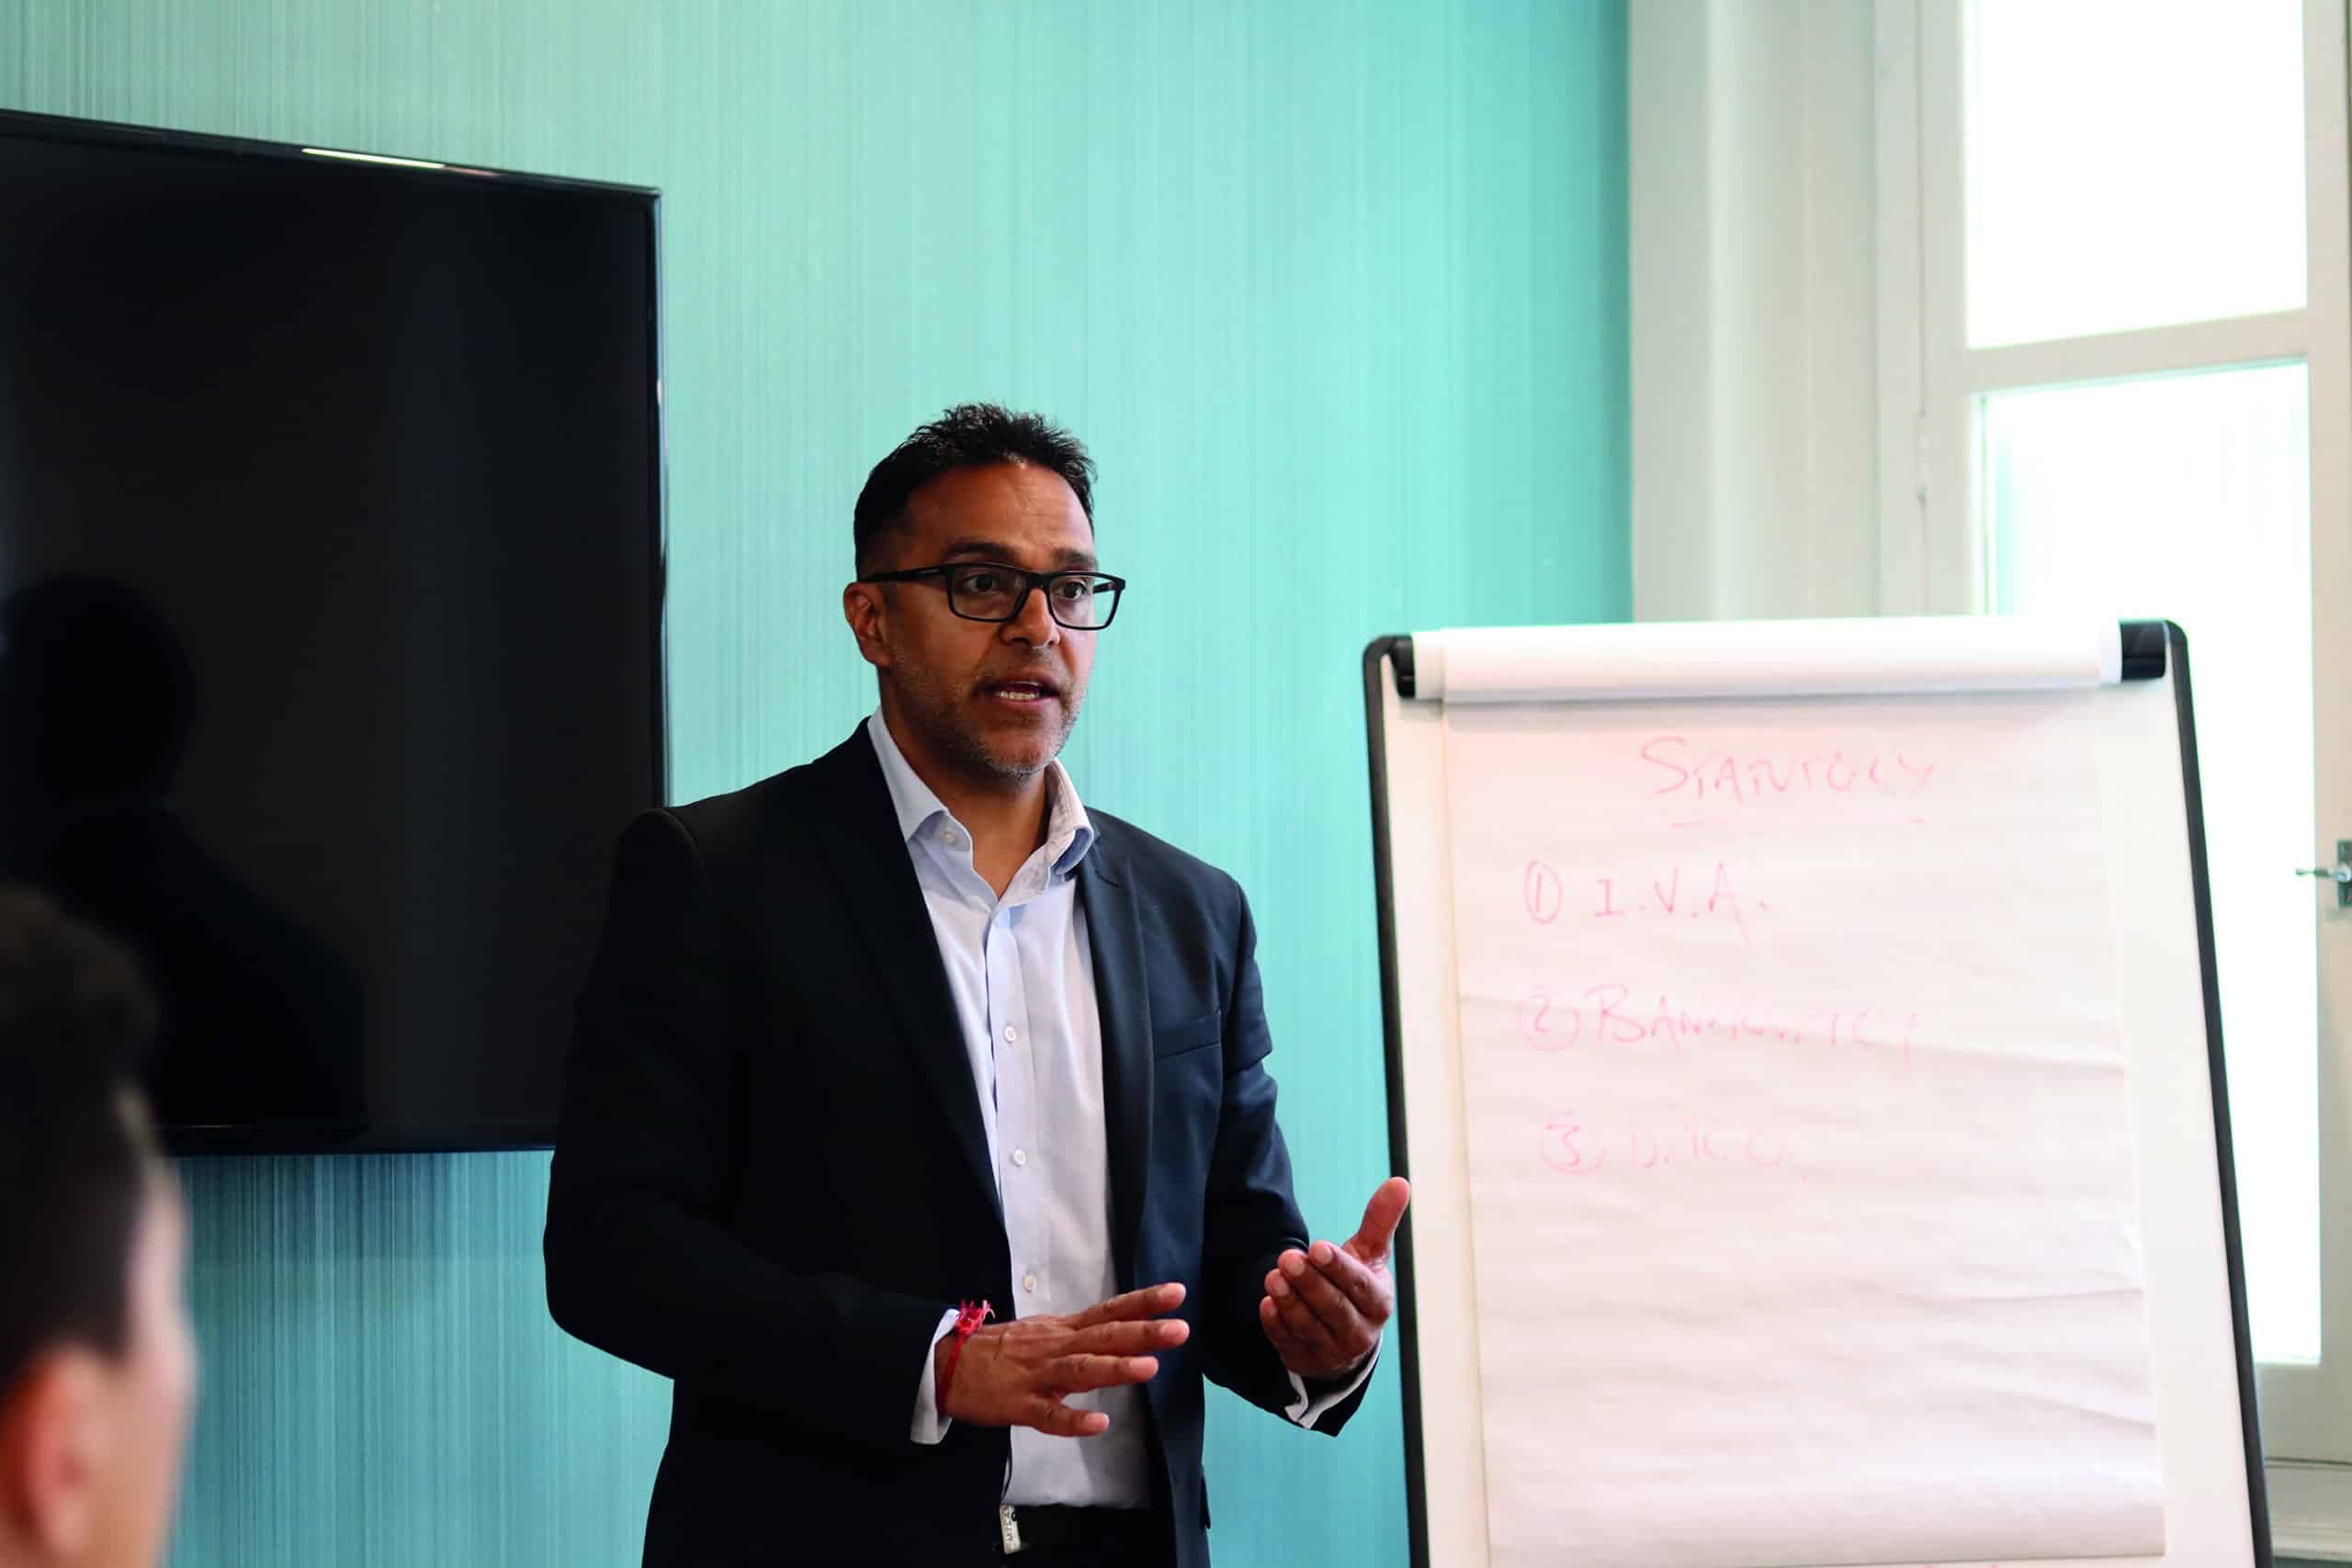
Insolvency Exam Training
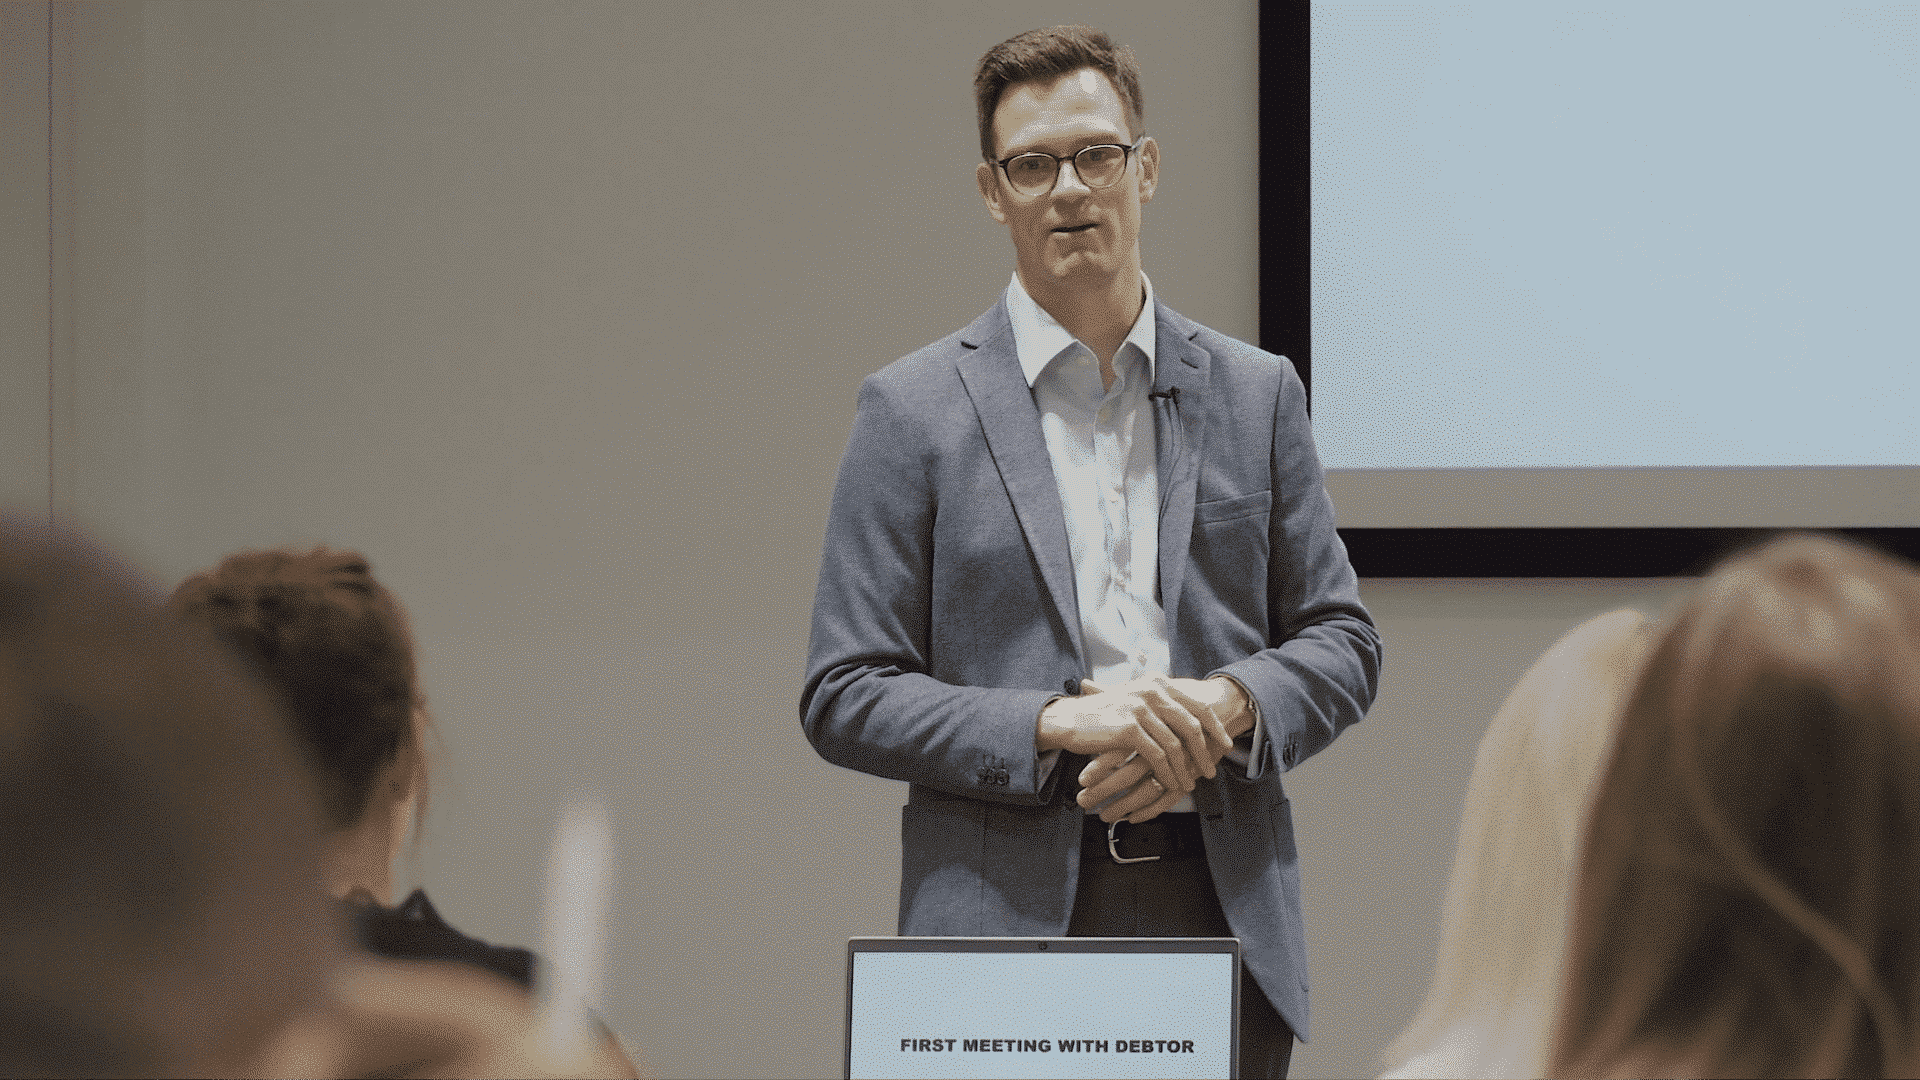
Aryza offers training – uniquely via our app and with face-to-face lecture training – for all insolvency and restructuring qualifications.
Compliance Services
Aryza has vital and specific expertise in conducting independent compliance reviews, positive and constructive reporting and follow-up training to ensure future compliance.

Personal Insolvency Solutions
Our team has decades of experience in offering training and qualifications to the insolvency sector, as well as working in partnership with many key players to ensure they are continuously compliant, work efficiently and fully informed.
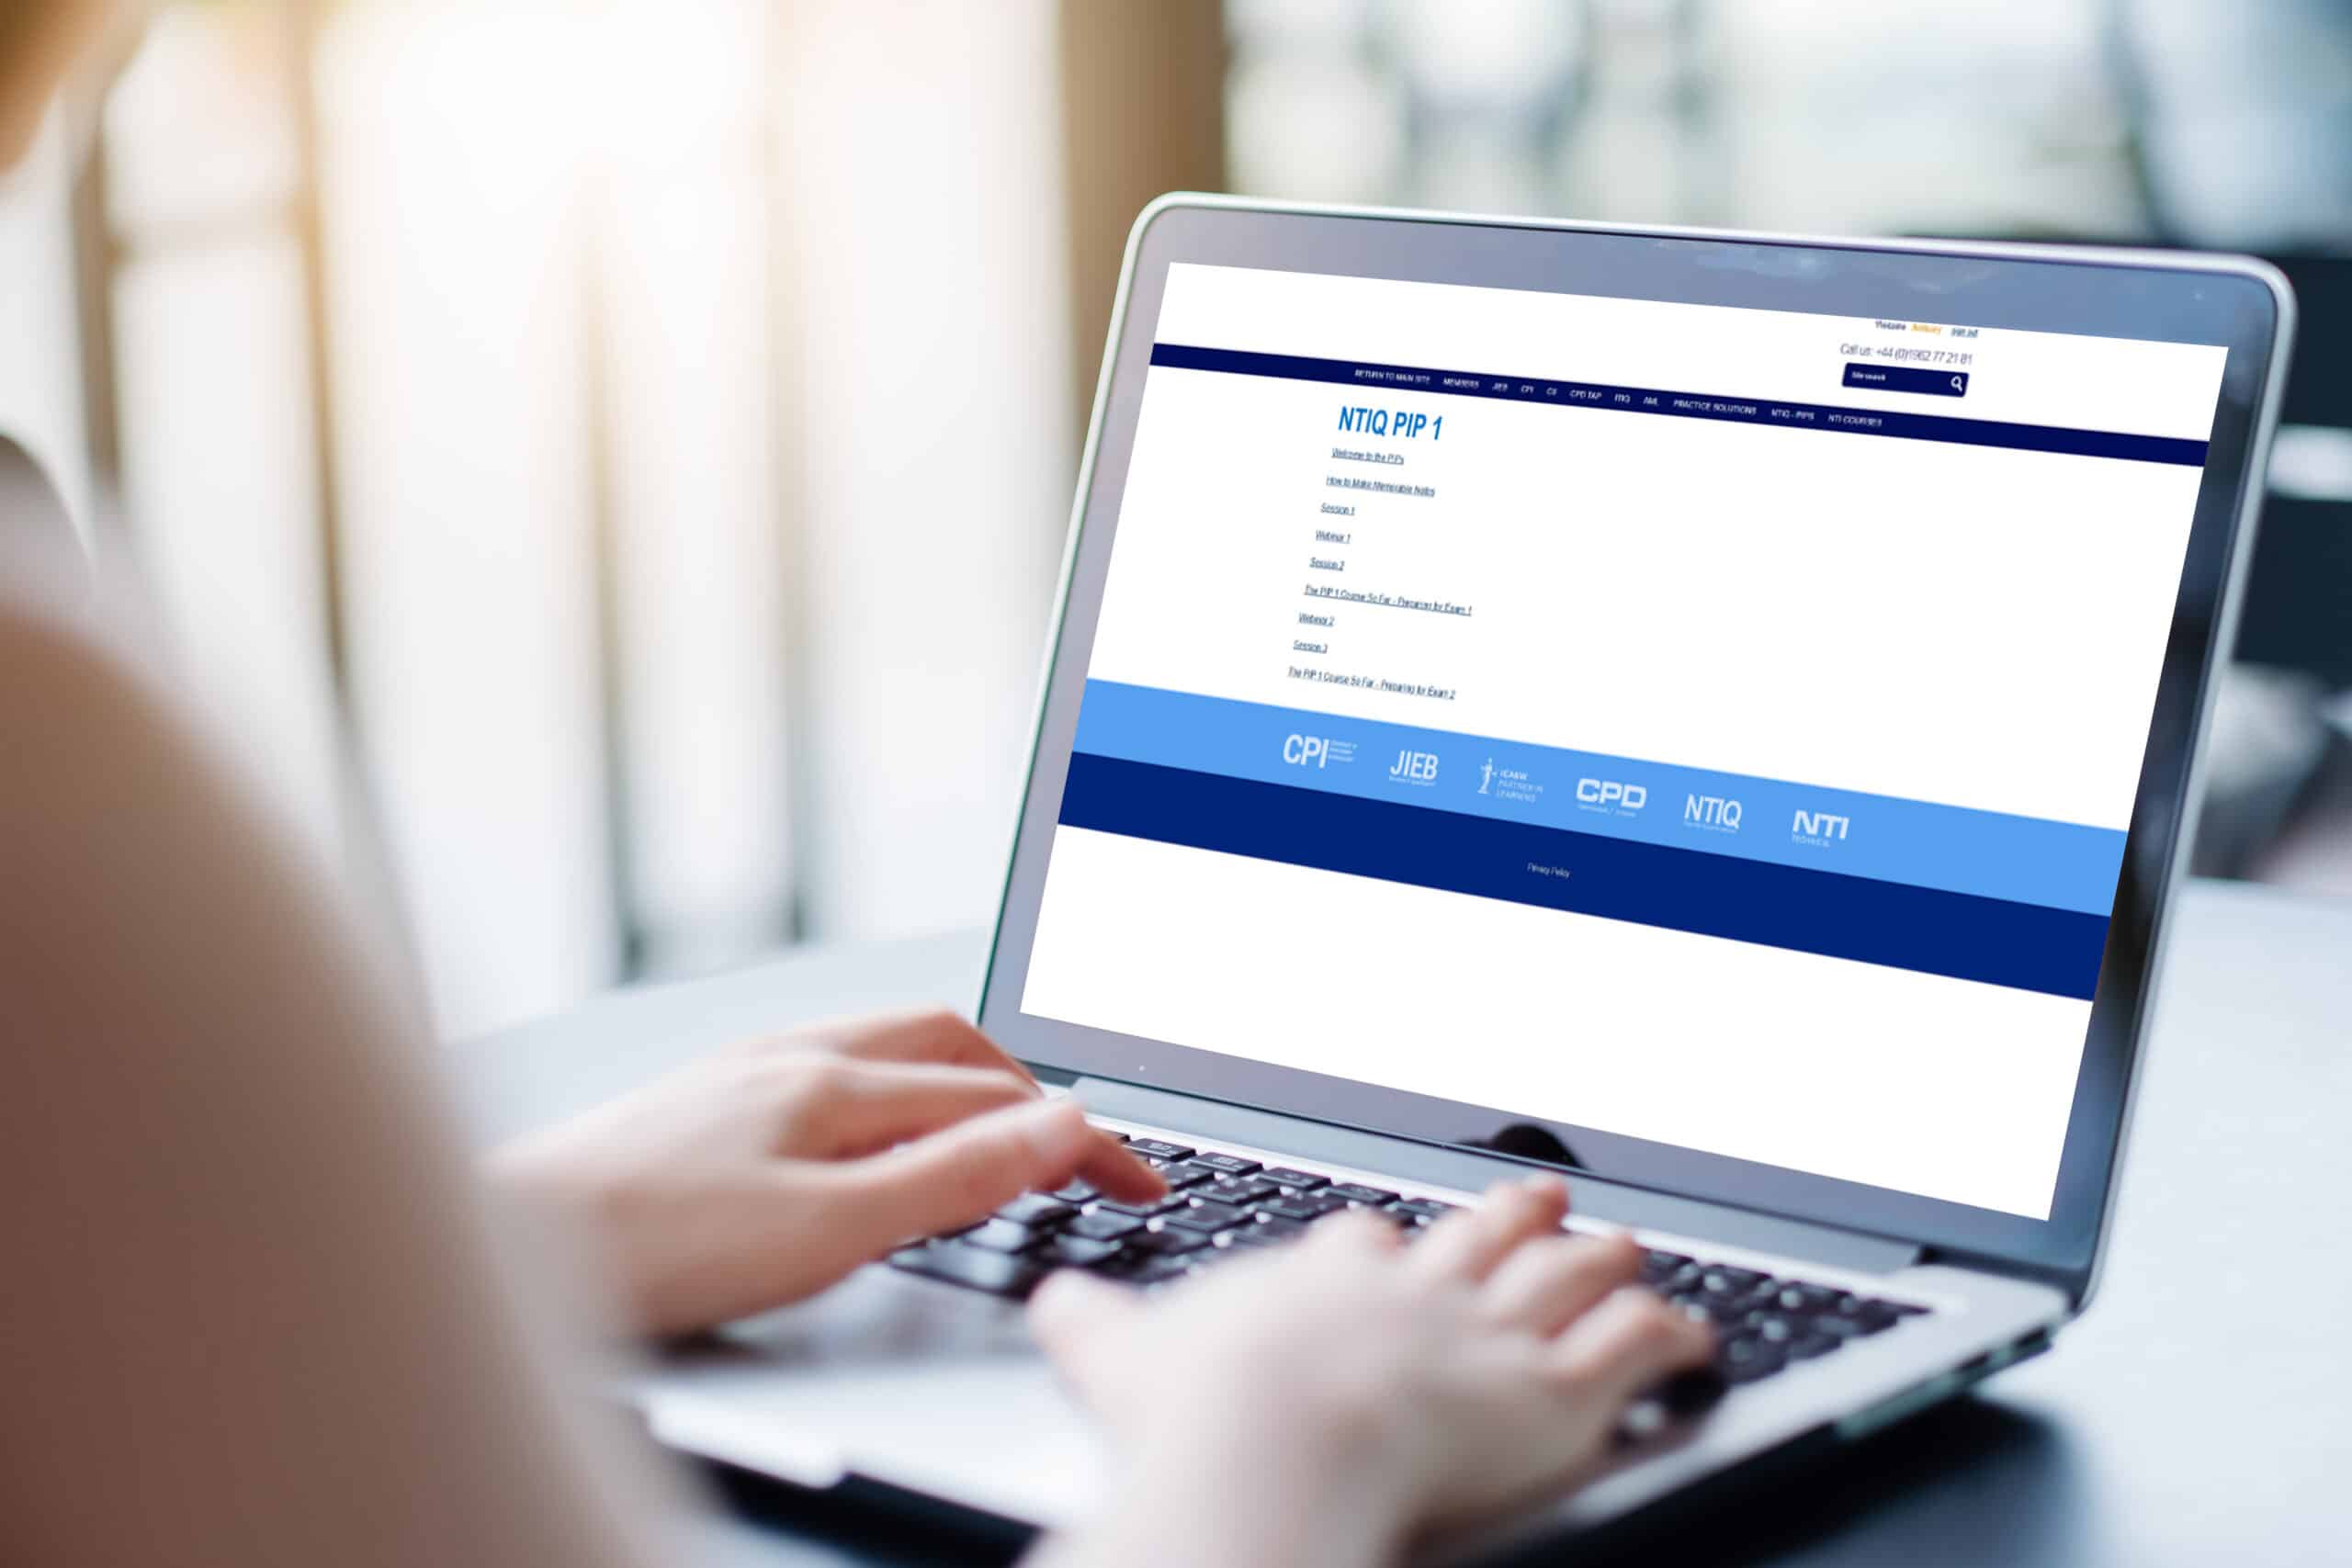
Professional Services Training
Essential service offerings and training sessions to enable insolvency professionals to comply with Government and Insolvency Service regulations, and to critically keep up to date at all times.
Continuing Professional Development (CPD)
CPD: Always Compliant
Aryza offers affordable, highly flexible and totally up-to-date CPD that ensures you, your team and your business is always totally informed and completely compliant.
Be certain that every member of the team has the latest information, is acting properly, and all licenses are safe.
Whether you are looking for a comprehensive, completely verifiable and reportable digital solution, or training delivered directly to your office (or on a discrete part of our app, unique to you), Aryza has the perfect option for you and your team.
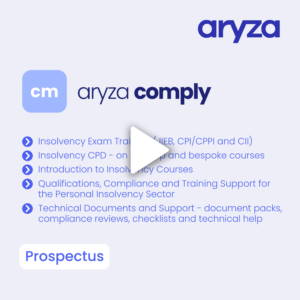
Download the Aryza Comply prospectus
Find out how our solution ensures seamless compliance and smarter risk management
To access our Members Area for all training services, including Aryza Develop and Bespoke Training, click here
Latest News

Contact us
"*" indicates required fields